Virtual Reality a Game Changer for Data Analytics

Ever wondered what it would be like to truly immerse yourself in data? Given the increase in data consumption and big data analytics, this thought could be realised sooner rather than later.
Today, many companies are starting to look at how virtual reality (VR) can improve their data presentation, as traditional tables, charts and figures are no longer cutting it because people are starting to become desensitised to this form of data visualisation.
Data visualisation is a key aspect of business in every industry. But with the aid of VR, it can go far beyond traditional 2D data visuals like pie charts or bar graphs by creating more accurate 3D models. The success of VR in the gaming and entertainment industry, like Oculus Quest 2 and The Void in Genting Highlands, proves that VR fares well in businesses when tailored to their needs.
VR applications serve as a great data visualisation tool as they offer users a chance to immerse themselves in raw data, allowing them to better control and comprehend the massive amount of data collected.
Understanding how VR can be used in data visualisation is extremely beneficial to data scientists and those studying to become one, regardless of their industry of choice. At Sunway University Online, our Master in Data Science offers students the chance to improve their data presentation skills through the Data Visualisation subject. Here are some benefits of VR in data visualisation:
Natural, Real-Time Interaction
It’s human nature to be sceptical of something when we’re unable to physically interact with it. Take for example, online shopping for make-up. Many people tend to avoid simply making purchases based on photos because they are unsure of how the product will actually look and feel on them in real life.
To alleviate their concerns, make-up companies, like MAC and Sephora, have employed the use of augmented reality (AR), which allows customers to virtually try on products before making a purchase.
Similarly, computer keyboards and mice are used to provide humans with a tangible way to interact with different software and applications. Now, imagine being able to physically move data around and manipulate data streams — that’s what VR can do for data visualisation.
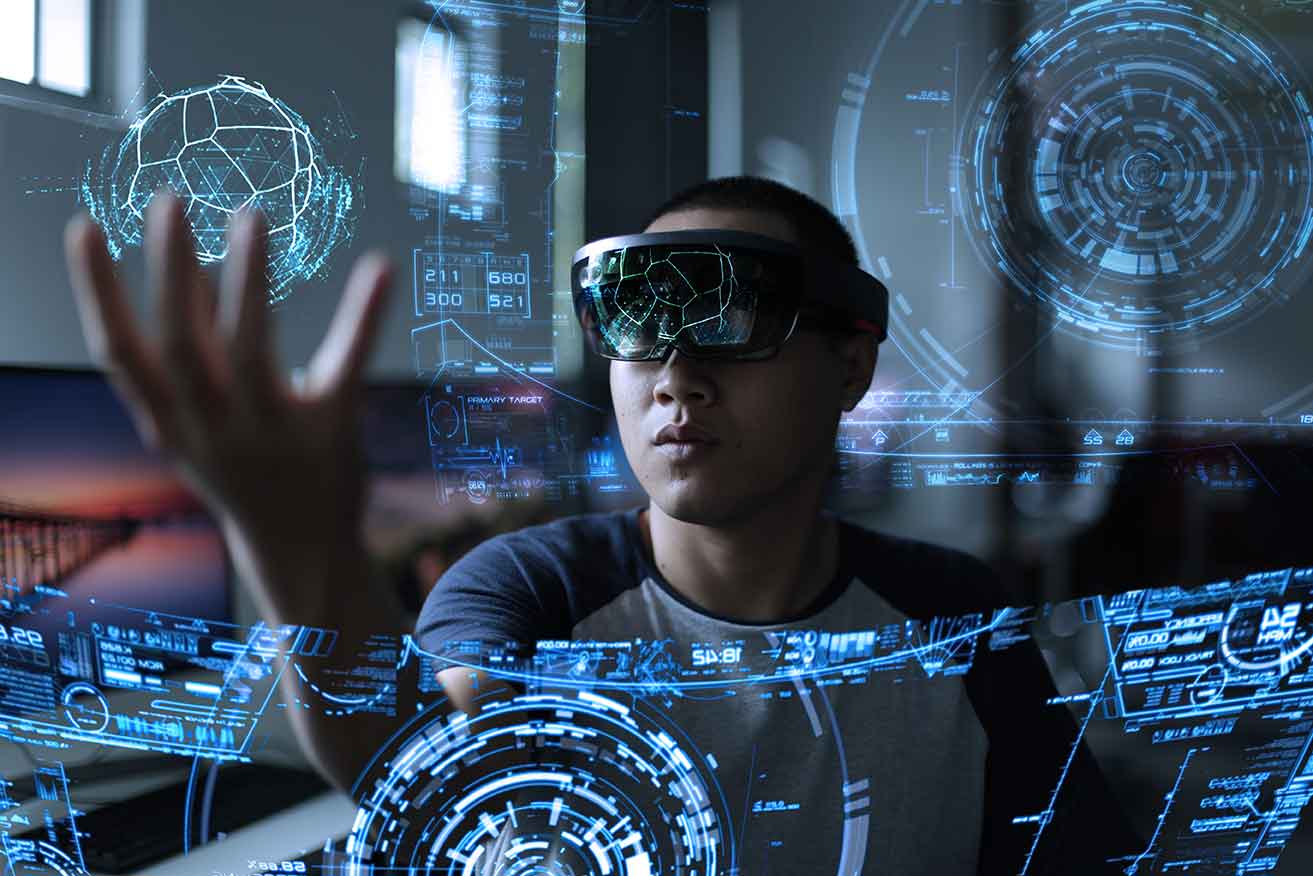
Using VR as a data visualisation tool gives users the unique ability to interact with virtual data models, enabling them to manipulate data in real time. This form of interactive data visualisation paves the way for better decision-making, as users will be able to physically see how data is stored and used.
This is also particularly useful for healthcare professionals as it gives them the ability to work around problems by running simulations and presenting successful outcomes to their patients. Companies like Surgical Theater and Vicarious Surgical are already implementing or preparing to implement the use of VR to train surgeons and assist in surgeries by maximising visualisation and precision. This way, both doctor and patient can be confident in the selected method of treatment.
The Bigger Picture of Big Data
Manually collecting and sorting through data can be time-consuming and, frankly, quite frustrating at times. Cramming all that data into one pie chart doesn’t provide much value, especially when non-data experts rely on it to make big decisions.
Implementing a VR system offers both data experts and professionals outside the field with the opportunity to view data holistically. This means that all the data gathered can be viewed at once, making it easier to see the bigger picture.
A great illustration of this can be seen in Marvel’s Iron Man franchise. Tony Stark is often seen using VR to get a better vantage point of how he can optimise his suits to boost performance and run probability simulations. While this may be fictional, it is a fantastic example of how VR, accompanied by data, can be used to improve and predict outcomes.

Better Understanding Means Quicker Decisions
It’s no secret that the human mind works in mysterious ways, and learning something new can take either minutes or days. But, did you know that our brains tend to process visual imagery at a faster pace?
A study by the Massachusetts Institute of Technology (MIT) found that the time taken for the human brain to process and understand images is a mere 13 milliseconds. This means that we only need to glimpse a photo once to have a decent idea of what it depicts.
When VR landscapes are used for data visualisation, we get to see a greater density of it all at once. Picture rock climbing, but you’re scaling up a wall of data. Once you reach the top, you’ll be able to look out and understand the greater data landscape.
This allows us to gather insights and derive meaning from big data faster because we’re able to view it in multiple dimensions. Our brains find it easier to understand the relationship between two or more variables when we’re able to feel the data presented. For example, being able to touch the axis in a scatter chart speeds up our cognitive process.
Essentially, VR and AR applications can help those without a background in data science fully understand the data being presented to them. Anyone can hop in the data world, get a good understanding of what they’re seeing, and extract information at any given time.
Changing the Way We Work
VR in data visualisation creates exciting opportunities for not just the data science field, but far beyond. It provides a new way for researchers and organisations to interpret and interact with data, facilitating better and quicker decision-making.
The skills you obtain from our online Master in Data Science will help you thrive and evolve in the modern business and IT landscape, and land a successful career in the industry of your choice.
Speak to our Education Counsellors to get the ball rolling today!


